Explore Page
The explore panel allows to get an overview of the text datasets, either as a table or visualisation.
Tabular View
The tabular view displays your data in a tabular view. Filters are available to assist your exploration.
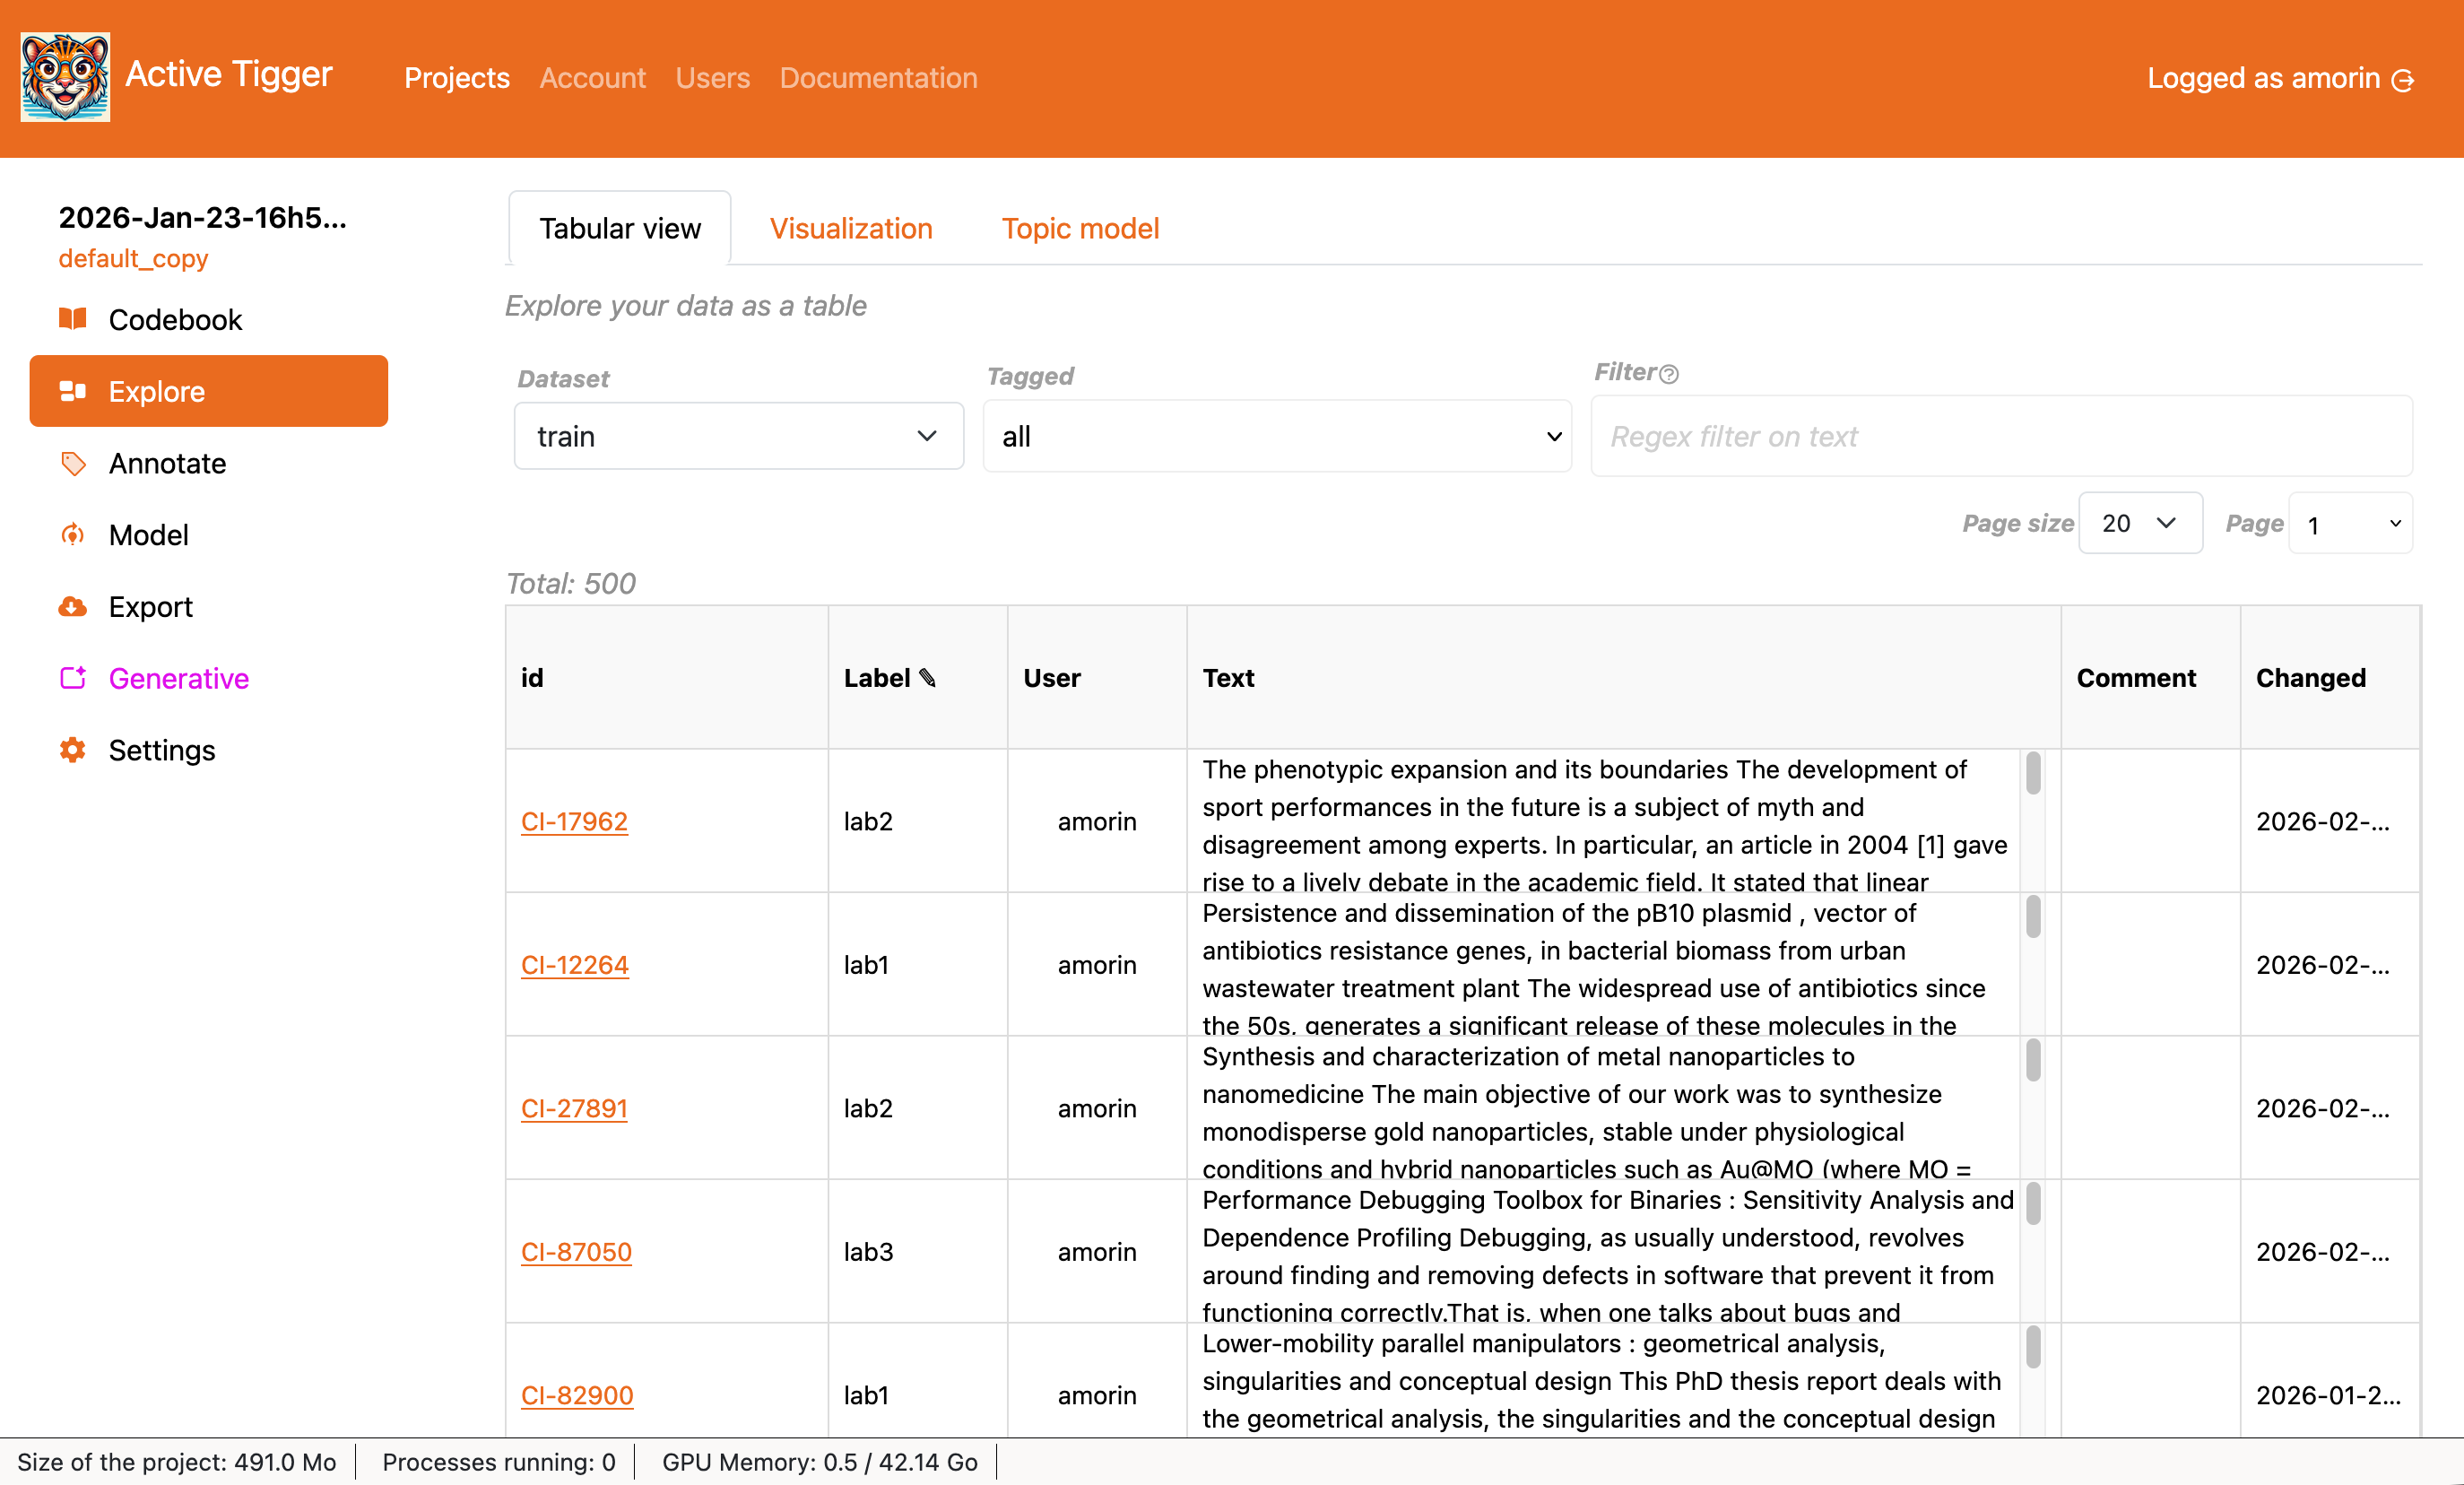
- Filters available
- Select the dataset to explore ("train", "valid" or "test").
- Select elements with a tag.
- Select elements given a regex query.
- The table: The table contains 6 columns including the id, the label, the user who produced the label, the text, comments (if any), and the date the label was produced.
- Click on the id to go to the Annotate page and annotate the text input.
- Click on the label to annotate in the tabular view. Click Validate changes to save changes in the database.
Visualization
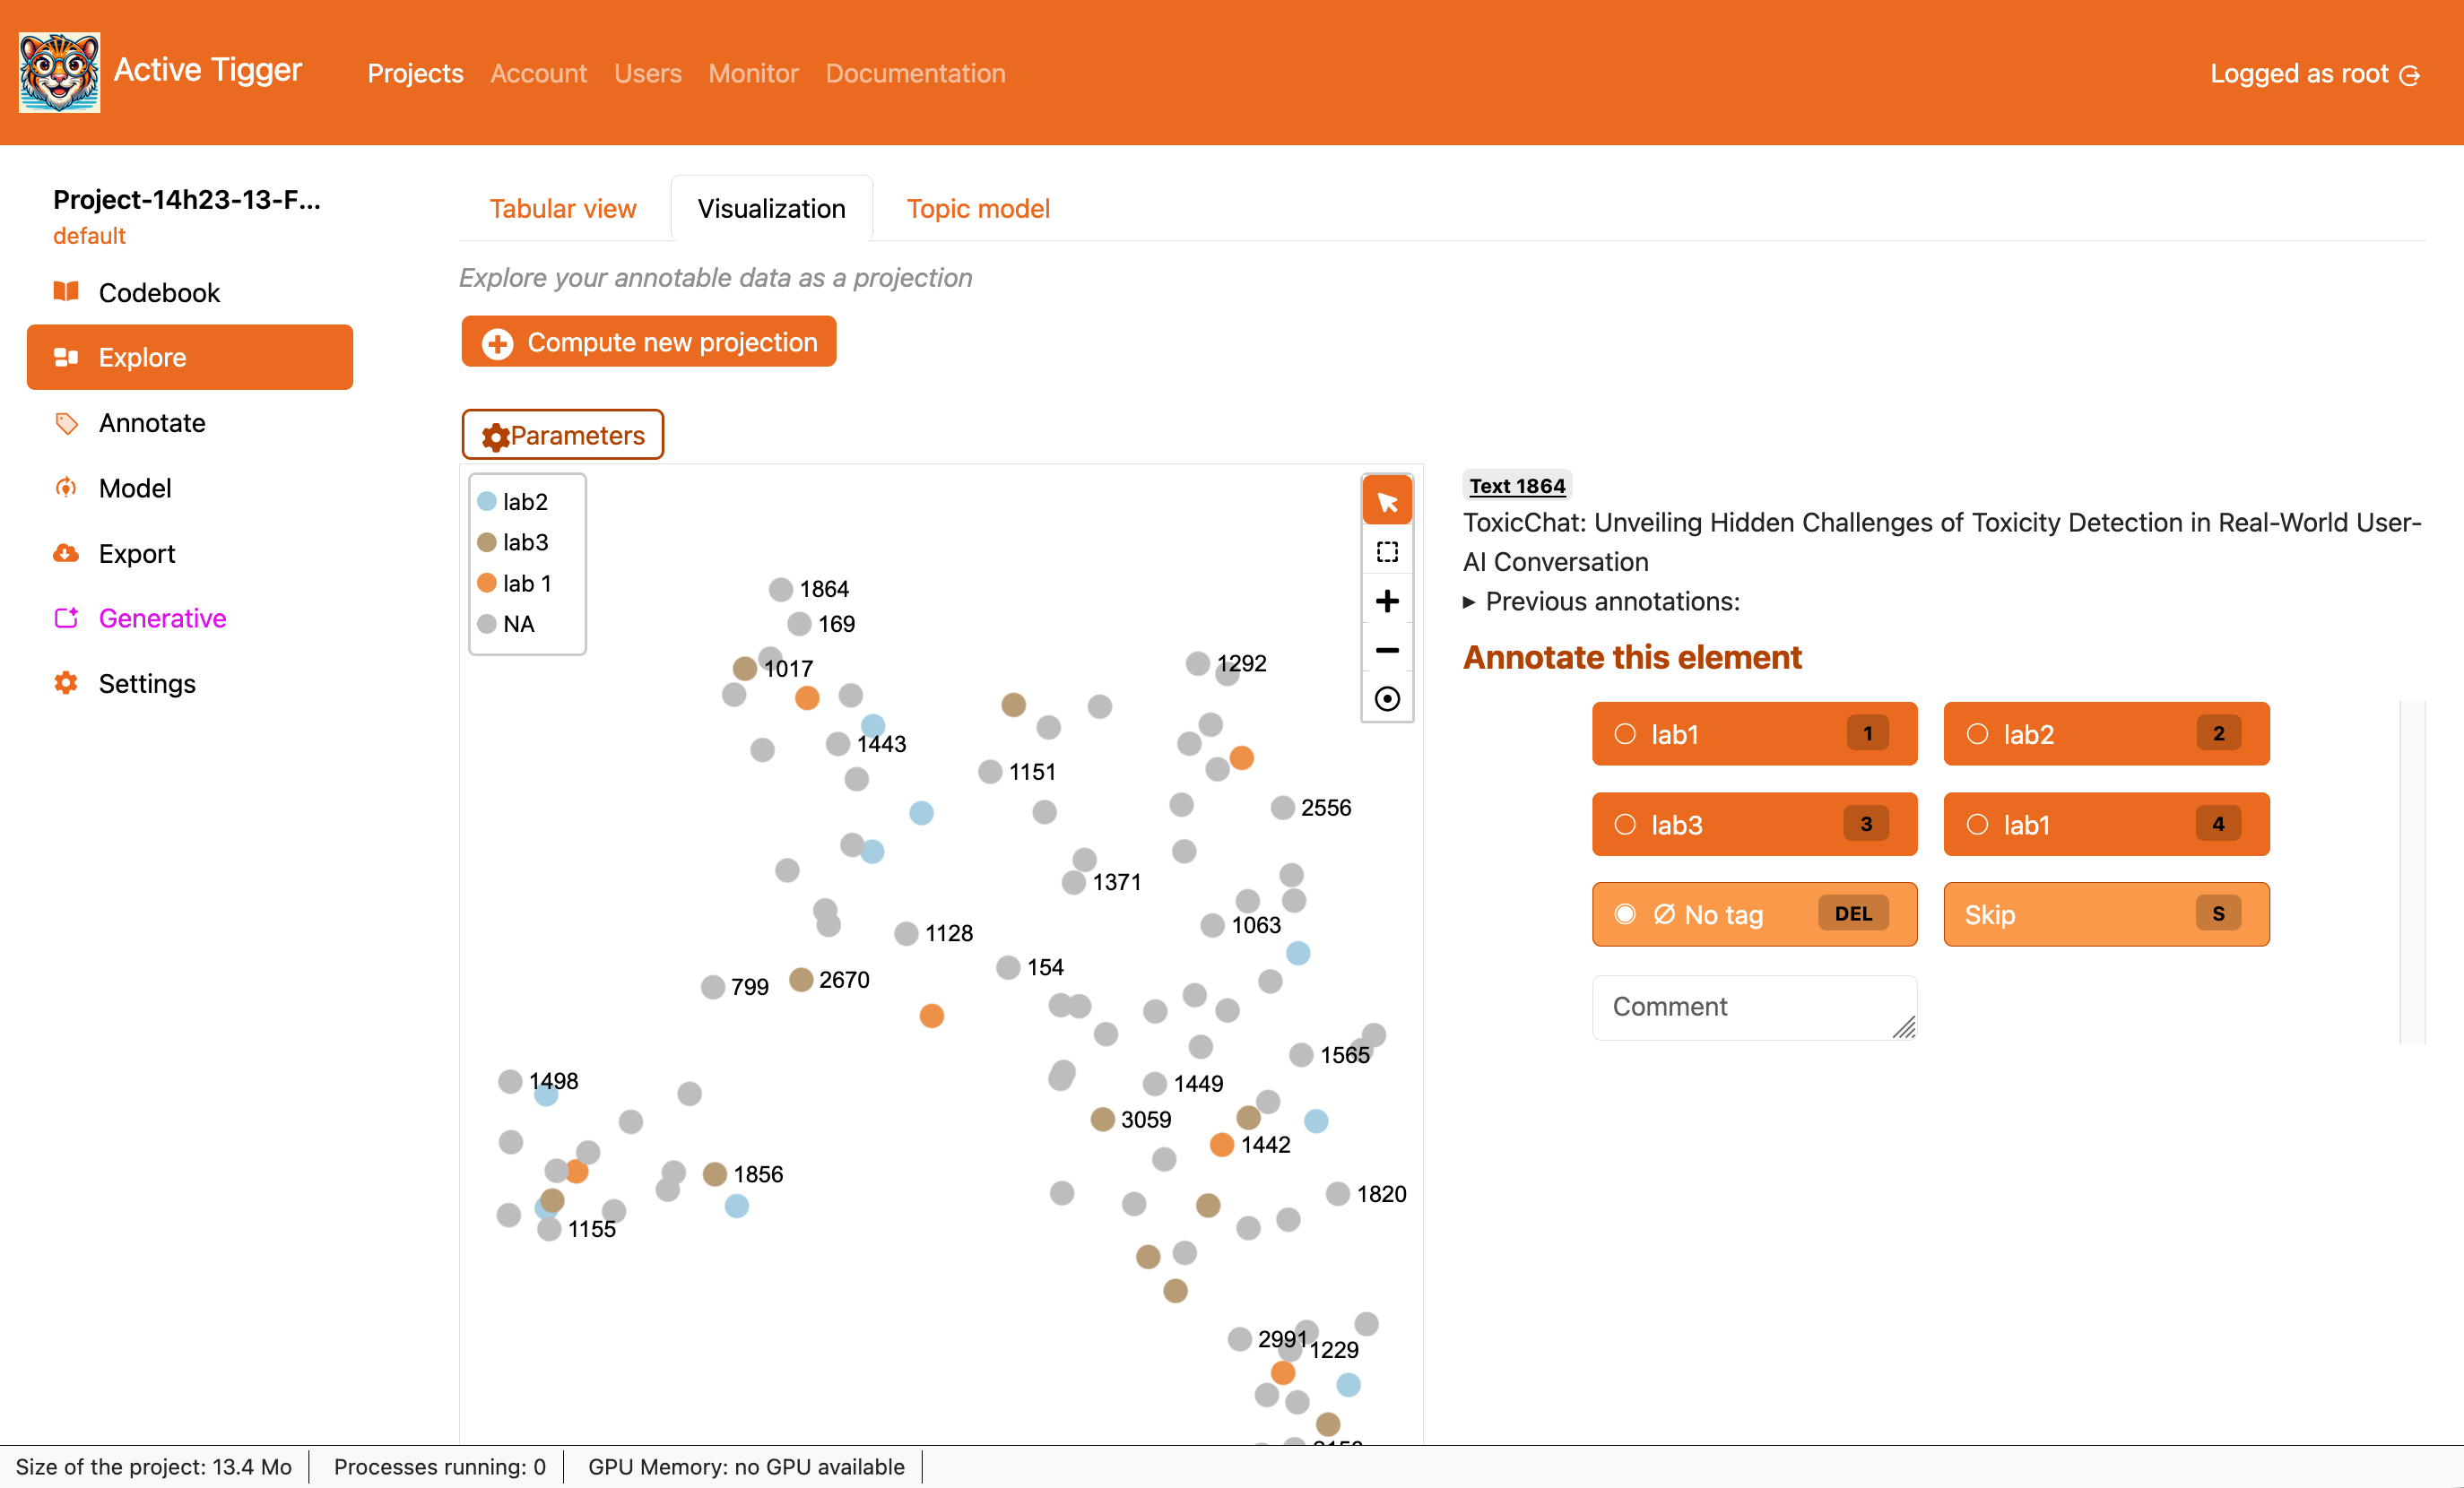
The visualization tab displays a projection of the embedding space in two dimensions. Projections are computed with either UMAP or t-SNE.
Warning
There is only one projection per project. Computing a new projection will overwrite the current projection.
- Compute new projection
- Select a feature: choose the set of feature (what are features?) to use for the projection. If choosing several sets of features, they will be concatenated before projection. Add a new feature to Compute new features.
- When using UMAP:
- n neighbors: Defines the size of a neighbourhood, hence whether two points are considered as "close" and should be kept together in the process or not.
- min distance: Aesthetic parameter, low values generate denser representations.
- When using t-SNE:
- perplexity: It controls the effective number of neighbors that each point considers during the dimensionality reduction process. (Source).
- Feature scaling: this method normalizes the range of independent variables (i.e. each feature) (should I scale my features?).
- Parameters to see the parameters of the current projection.
- The visualization panel displays each text input in a 2D space. The color of the node depends on the label, or the absence thereof.
 to select a subset of text inputs.
 removes the frame.
- If a frame exists,
 Lock the selection to lock on the frame. Going to the Annotate page will only display elements in the frame.
 - Clicking a node displays the text input as well as previous annotations and the Annotation Panel, much like in the Annotation page
Projections can be downloaded from the Export page.
Topic model
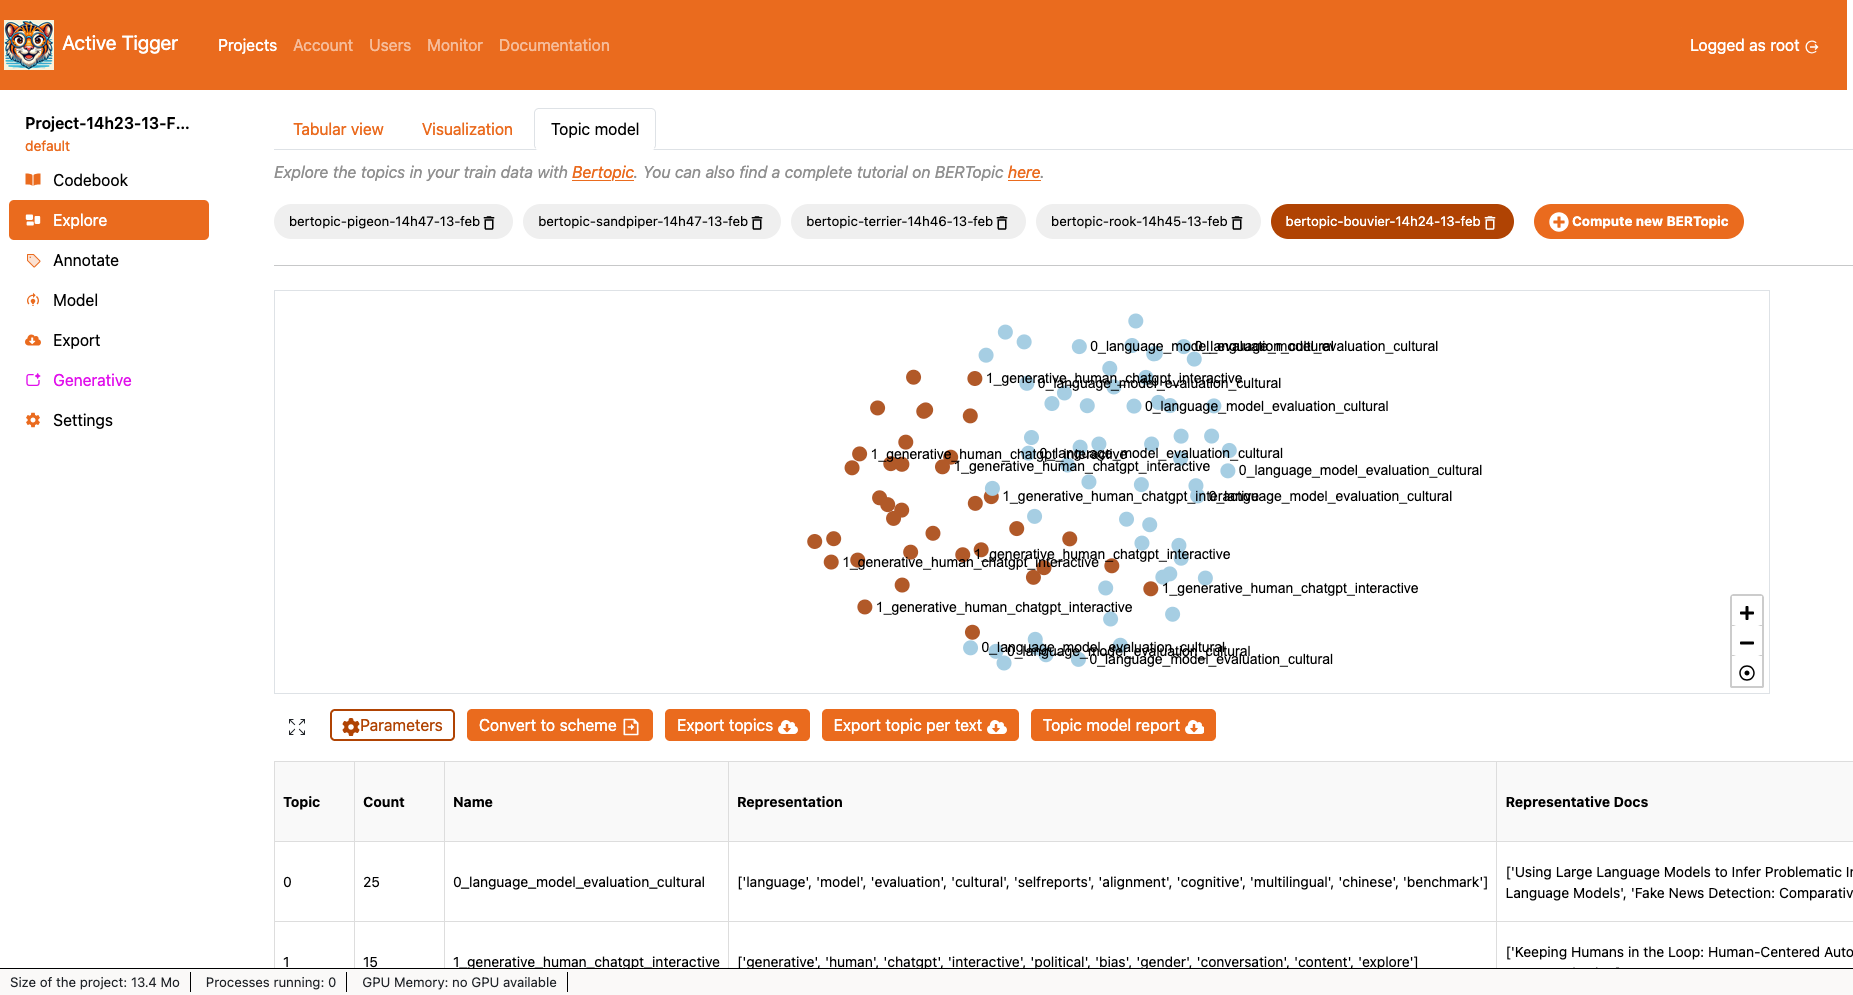
The topic model) section displays existing topic models (for a given project, across all users) and allows to compute new ones with BERTopic1.
The visual representation of the topics displays each text input as a node with a color corresponding to the topic generated by the topic model.
- Compute new BERTopic to create a new topic model.
- Name: must be unique (per project)
- Embedding model: choose from the available embedding models to compute the embeddings that will be used for fitting the model. These embeddings will be computed if they do not exist already for a given dataset.
- Number of neighbours: UMAP parameter — a dimension reduction algorithm; low values will generate a topic model focusing on local structures (i.e. very specific topics) whereas higher values will generate a topic model focusing on the overall structure (i.e. general topics) (more here).
- Min topic size: HDBSCAN parameter — a clustering algorithm —, this parameter corresponds to the minimum number of elements in a group to be considered a cluster, otherwise the group is considered as noise. Increasing this value will generate a few large groups, while decreasing this value will generate many small groups.
- Outlier reduction: If set to
True, all text inputs considered as noise will be added to the closest topic (more info). - Force compute embeddings: If set to
True, the app will first generate the embeddings overwriting any existing embeddings. - Input dataset: Which dataset should be used to fit the model (train, train + test + valid or the complete dataset uploaded to the project).
- Filter out texts of length lower than: Before fitting the model, exclude text inputs of length inferior to this value.
- Number of components: UMAP parameter — a dimension reduction algorithm; it defines the number of dimensions the algorithm reduces the embeddings to. Low values will flatten the representation of the input texts, whereas higher values maintain a richer representation (more here).
- Parameters to see the parameters of the current topic model.
- Convert to scheme to create a scheme and assign labels using the topics generated. Topic-generated labels should be used with caution and carefully reviewed, since they are not based on human annotation.
- Export topics to download (csv file) the topic table displayed underneath.
- Export topic per text to download a mapping of each element id2 to the topic index.
- Topic model report to download an HTML report with key insights (topics description, 2D map, hierarchical representation, representative documents and the parameters of the model).
- The table summarises the topic model.
- Topic: the topic id.
- Count: the number of elements in the topic.
- Name: A standard name for the topic.
- Representation: A list of keywords that represent the topic.
- Representative docs: A list of documents that are at the core of the topic generated.
-
Find a full tutorial on BERTopic for the social sciences here. ↩
-
As set up when creating a project. ↩